In the fall of 2015, the City of Sand Springs launched an online survey for residents of Sand Springs. More than 600 individuals responded, representing more than 3% of the population.
43.9% of residents view the image of Sand Springs as Good. 19.7% of residents have a negative view of the City. 44.5% of residents believe non-residents have a Below Average view of the City. 55.4% of residents believe non-residents have a positive image of Sand Springs.
28.4% of residents rank the quality of life in the city as High, 66.9% ranked it as Moderate, and 4.7% ranked it as Low.
79.8% over residents rank the quality of Public Safety as above average. 1.2% rank it as below average. 82.9% of residents are satisfied with Police services in Sand Springs while 1.8% are dissatisfied. 90.6% of residents feel safe while walking alone in their neighborhood. 71.3% of residents feel safe walking in downtown Sand Springs at night.
85.9% of residents are satisfied with Fire response services. 84.9% of residents are satisfied with the Emergency response service provided by the Fire Department.
49.3% of residents would definitely support a funding mechanism to hire additional police and fire personnel. 44.5% would possibly support it, and 6.1% would not support it.
85.4% of residents are satisfied with the variety of housing for sale. 63.9% of residents are satisfied with the variety of housing for rent. 81.6% of residents are satisfied with the overall condition of housing.
76.5% of residents have a favorable view of the appearance of downtown. 74.7% of residents are satisfied with the appearance of the business areas outside of downtown.
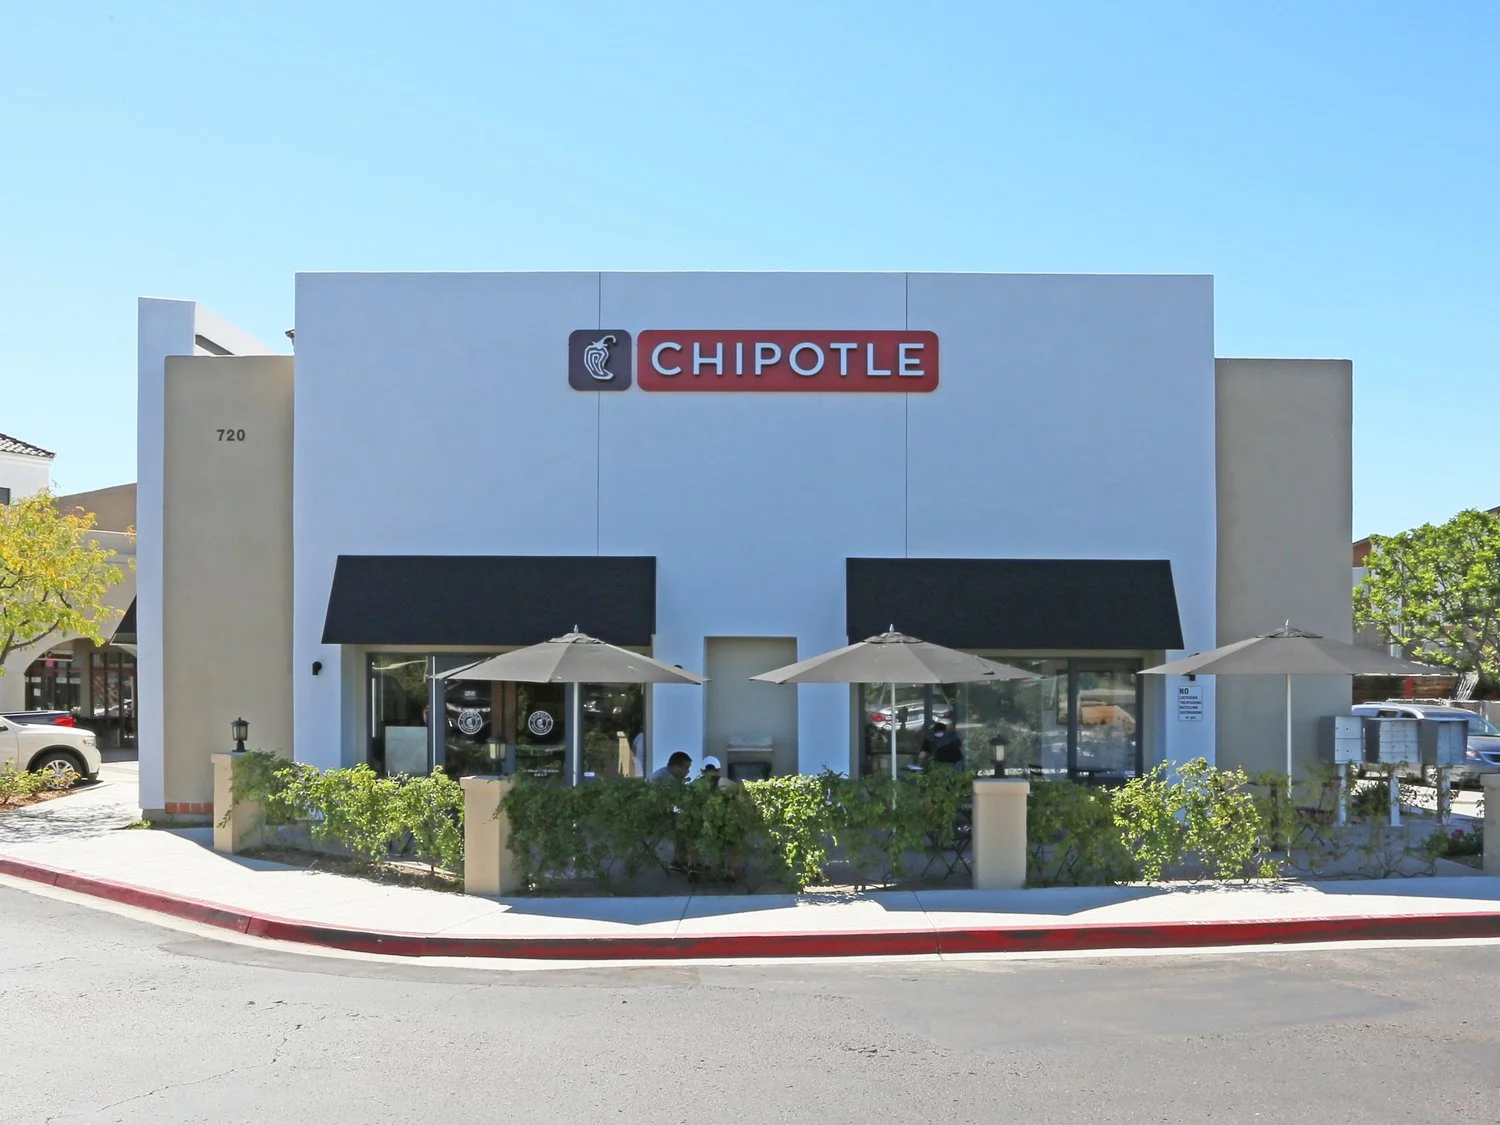
89.9% of residents sited Additional Retail/Restaurants as the primary development need in Sand Springs. 75.4% of residents listed Hardware/Home Improvement as the top retail need in Sand Springs. 93.2% of residents desire more Sit-down Establishments. 49.3% of residents visit Tulsa to eat very frequently.
46.3% of residents would definitely like to see an increase in establishments providing night life opportunities. 71.1% of residents would definitely support the redevelopment of old industrial areas as something else other than industrial.
47.5% of residents definitely support the construction of the Sand Springs Dam, 43.9% would possibly support it, and 8.6% would not support it. 64.3% of residents would definitely support development of the Arkansas River, 30.9% would possibly support it, and 4.8% would not support it.
51% of residents definitely support a system of city-wide trails, 41.2% would possibly support it, and 7.8% are opposed.
35.9% of residents would like to see additional Residential Development West of town, 31.6% said South of town, 24.4% said North of town, and 8.1% said East of town. 70.3% of residents are in favor of the annexation of additional lands into City Limits. 34.8% of residents support additional multi-family apartment complexes, with 24.9% opposed.
25.7% of residents are dissatisfied with the Sand Springs Parks and Recreational Opportunities. 36.1% are dissatisfied with the quantity/quality of parks in Prattville. 33.5% are dissatisfied with the quantity/quality of parks on the North side.
73.6% of residents cited a need for the demolition or redevelopment of blighted areas. 35.4% of residents said the Street and Road Conditions were in the greatest need of public improvement. 59.8% of residents believe Sand Springs road conditions are the same as other communities, while 27.6% believe they are better and 12.7% believe they are worse.
If public funding is required to improve the city, 66.1% of residents would support a dedicated sales tax, 33.1% would support a revenue bond, 31.2% would support a property tax, 21.6% would support development fees, and 15.8% would support a surcharge on utilities.
